Separate the layers. PowerPoint / Slides / Canva are the container — they hold pages and own transitions. Everything that lives on a page is made by a producer, by content type. The upstream synthesis (NotebookLM) comes first, then ten producers — eleven artifacts, all Burjeel.
00 · Narrative synthesis (upstream)NotebookLMsources → grounded brief
Briefing — Burjeel × Roche1 source PDF · 13 slides · grounded only in the source, no outside facts
- S1 Africa IVD market $1.38bn → $1.91bn by 2034, split across 54 nations with no integrated operator.
- S2 47% lack access to diagnostics (81% in low-income); 94% of the malaria burden sits in Africa.
- S3 Model — the Kupanda turn-key lab: Roche reagents on rental, Burjeel operates, AD Ports finances.
- S4 Precedent — Kenya MES (98 hospitals) works; Lesotho QMMH (51% of the health budget) is the cautionary tale.
▶ Audio overview
A source-grounded briefing — every line traceable to the source PDF, nothing invented. The upstream step: the narrative, before any slide is built.
01 · DiagramMermaidtext → diagram
flowchart LR
  G["Government
concession"] --> N["National
IVD network"]
  D["DFI / Abu Dhabi
finance"] --> N
  N --> RB["Roche + Burjeel
deploy & operate"]
  RB --> R["Revenue share
across the network"]
The PPPP money-flow, written as four lines of text and rendered live. An LLM authors the diagram directly.
02 · Chart / data-vizChart.jsdata → chart
Africa IVD market, $1.38bn → $1.91bn (2025–2034). Live, re-styleable in one line, sourced.
03 · Mapgeopandas / Datawrappergeo → map
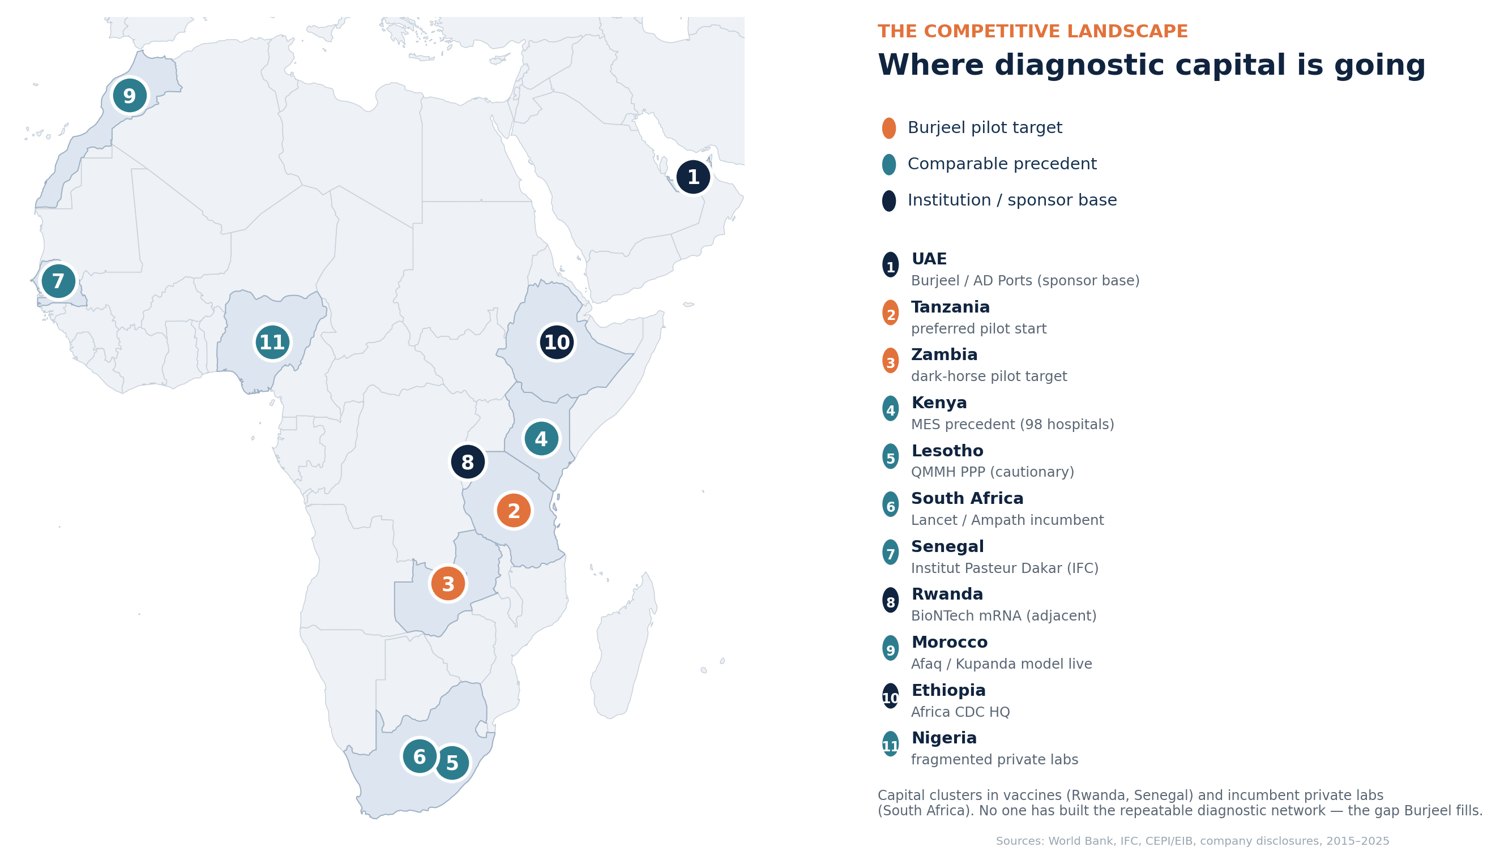
Where diagnostic capital is going — numbered markers, colour-keyed legend. The redesigned competitive map.
04 · InfographicCoded / Piktochartstats → blocks
47%
of Africa lacks access to essential diagnostics
81%
deficiency in low-income countries
94%
of the world's malaria burden sits in Africa
54
nations, no integrated diagnostic operator
The diagnosis gap, as stat tiles — icon-and-number blocks the eye reads in seconds.
05 · Photo / imageryHiggsfield · Pexelsreal / AI stills
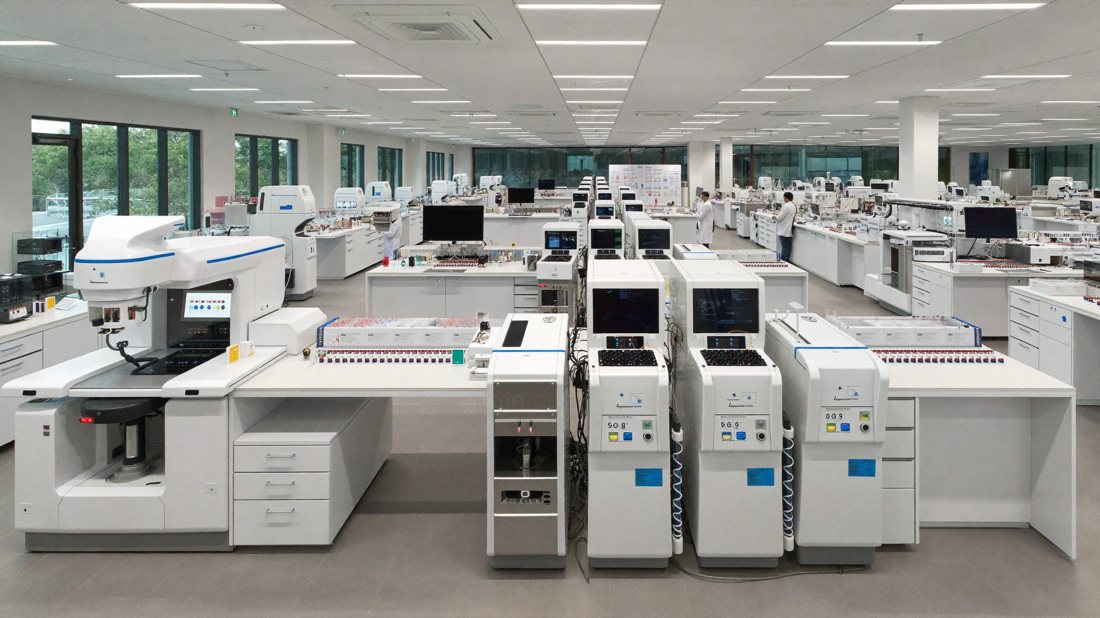
The product — a real diagnostic-lab interior. Stock for the real world, Higgsfield for controlled scenes.
06 · Icon setPhosphorconsistent SVG
One icon family, identical weight and grid — what stops a deck looking stitched-together.
07 · Vector illustrationRecraft / SVGbrandable vector
A diagnostics motif — flask, sample, pulse — as editable vector. Recolours to any brand, never pixelates.
08 · Animation (in-slide)Lottie / CSSmotion build
The build animates — bars grow on a loop. In a deck this is a reveal; here it runs live in CSS.
09 · VideoRendered MP4 · Runway/Synthesiamotion → file
Illustrative network revenue, drawn as a 3-second clip — a real .mp4 that embeds straight onto a slide.
10 · 3D / interactiveThree.js · Splinescene → embed
Pilot markets in 3D — Tanzania, Zambia, Kenya as live rotating bars. Drag-free, auto-spins.
Every panel was produced for this page by the tool named on it. The container (PowerPoint, Slides, Canva, reveal.js) would assemble these into pages and own the transitions between them — the one content type that lives in the container, not in a producer.