A working playbook, not a portfolio
Everything needed to produce a board-grade deck with AI: the process that lifts quality, the tools that build each piece — slides, charts, diagrams, maps, imagery — the templates to start from, and the benchmarks to clear. Point us at a deck and we apply all of it. The Burjeel case study at the end shows the whole pipeline run once, end to end.
The 6 → 9 method
A 9/10 deck is never one prompt. It is a pipeline — research, critique, redesign, critique — with a tool at each stage. This is how LLMs and tools actually get there:
The AI slide-development toolkit
The full stack that does the work, by pipeline stage. ✅ = wired in and used here; ◆ = world-class, callable. Tell us a job; we reach for the right one.
▸ Open the interactive toolkit — 30 expandable live demos, one per tool →
Author & edit the deck
python-pptx / pptxgenjs
Scripted .pptx — pixel control, charts, master layouts. How the case-study deck was built.
docs →Workspace MCP
Create & edit native Google Slides programmatically, shareable in your Drive.
Slides API →Canva MCP
Generate designs, autofill brand templates, export — type + brand-kit composition.
canva.com →HTML → Express
Author pixel-controlled HTML, import as an editable Express document.
express →reveal.js / Slidev
Code-native HTML decks, deployable to a URL, fully themeable in CSS.
revealjs.com →Gamma
Prompt-to-deck/site generation with an API; fast first drafts to refine.
gamma.app →Beautiful.ai · Pitch · Tome
Template-intelligent AI deck builders; strong for speed and consistency.
beautiful.ai →Charts & data-viz
Datawrapper
Publication-grade charts/maps/tables; full REST API to batch-create.
datawrapper.de →Flourish
Animated, story-driven charts; Live API to drive any template.
flourish.studio →Plotly / matplotlib
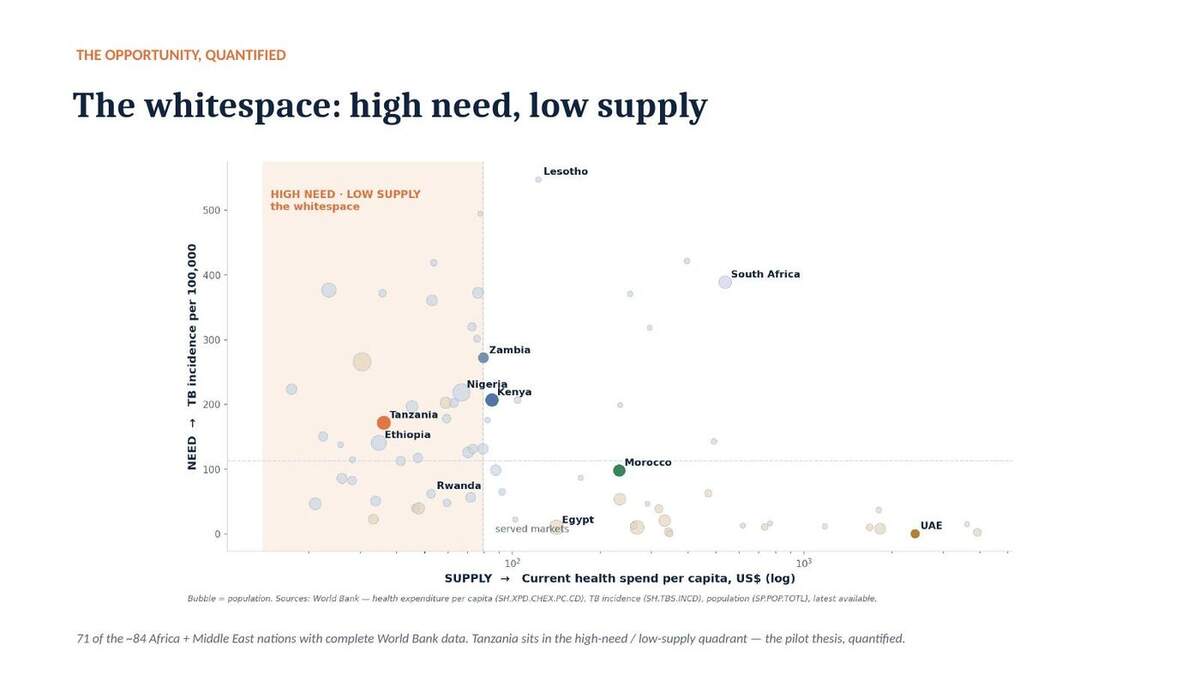
Python charts from a CSV. Built the case-study needs-vs-supply matrix.
plotly →Observable Plot / D3
Concise JS charts (Plot) or fully bespoke (D3). Maximum control.
observable →Vega-Lite / ECharts
One JSON = one chart — ideal for auto-generated, AI-specified viz.
vega-lite →RAWGraphs
Alluvial, beeswarm, bump, treemap — the charts other tools skip.
rawgraphs.io →Diagrams & maps
Mermaid
Flowcharts, sequence, ERD, Gantt from code. Scriptable, GitHub-native.
mermaid.js →draw.io / diagrams.net
Pro flowcharts, cloud/network architecture, UML, BPMN.
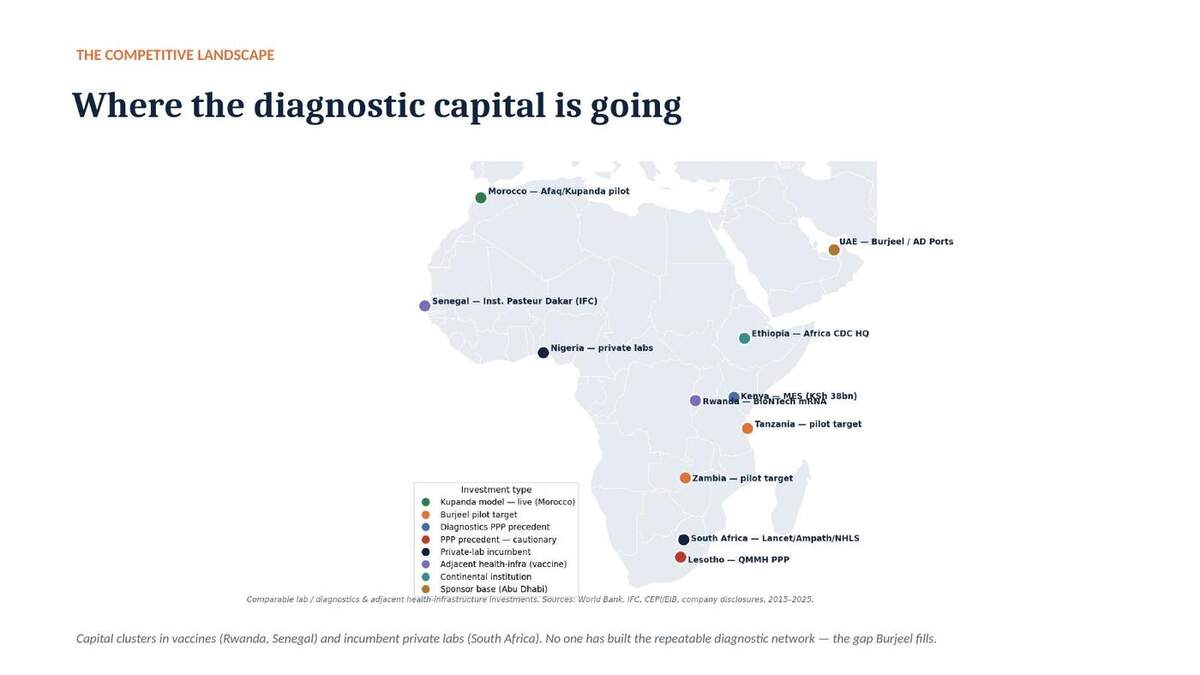
diagrams.net →geopandas + Plotly
Scripted choropleth & bubble maps. Built the case-study investment map.
geopandas →Datawrapper · Mapbox · Felt
No-code choropleths to custom vector maps and collaborative GIS.
mapbox →Imagery, icons & stock
Higgsfield
Unlimited-tier character/scene stills. Generated the case-study photography.
higgsfield.ai →OpenAI gpt-image-1
In-image text and photo edits/composites — the leg Higgsfield doesn't cover.
docs →Pexels (live) · Unsplash · Pixabay
Real licensed photography via API. Pexels keyed & live; Unsplash/Pixabay queued.
pexels API →Lucide · Phosphor · Tabler
Open, consistent icon families (Phosphor: 9k icons, built for decks).
phosphor →Design systems & CSS you can lift
Tailwind · Open Props
Drop-in design tokens & utilities for HTML/reveal decks and microsites.
open-props →Pico.css
Class-light semantic CSS — instant clean typography for doc-style decks.
picocss.com →100+ templates you can use & change
A working catalogue — 72 Slidesgo themes, 20 Pitch decks, Figma & Canva libraries — each tagged by how the toolchain edits it: drive it directly through an MCP, or download and rebuild. Browse all 102 →
The standards — 20 board-grade exemplars
The canon isn't a pile of templates — it's a handful of sources that generate good slides, plus the real decks that prove the point. Links go to the best public home for each.
Minto — The Pyramid Principle
Governing thought on top, MECE support below. The grammar of every consulting deck.
barbaraminto.com →Zelazny — Say It With Charts
Pick the chart from the message: comparison→bar, trend→line, composition→stacked.
The reference →SCQA + the ghost deck
Sketch every slide as a one-line title before building a pixel.
Worked examples →The "so-what" headline
The title states the insight, not the topic. Read the headlines alone and you've read the deck.
See it applied →Airbnb — seed deck (2009)
The deck that shaped all pitch decks: one idea per slide, ruthless brevity.
View the deck →Uber — pitch deck (2008)
Dense market logic made legible; a masterclass in sequencing.
In the collection →Sequoia — pitch deck template
The canonical 10-slide skeleton VCs expect. The default to bend, not break.
sequoiacap.com →Dropbox — seed deck
A simple product, a clear wedge, a believable path to scale.
In the library →LinkedIn — Series B (annotated)
Reid Hoffman's deck with the reasoning behind every slide. A teaching artifact.
reidhoffman.org →McKinsey Global Institute
Exhibit-led pages: one chart, one takeaway, sourced footers.
mckinsey.com/mgi →BCG Henderson Institute
Concept diagrams that carry an argument — the schematic as the slide.
bcg.com →Bain — strategy decks
Tight executive summaries; the answer-first page that respects a board's time.
bain.com →Stripe annual letters
Prose-and-chart hybrids — land a complex point without bullet soup.
stripe.com →Slidebean — 35+ startup decks
Annotated, downloadable real decks from funded companies.
slidebean.com →Figma — 34 pitch deck examples
Modern, design-led examples with the why behind each layout.
figma.com →Visme — 18 funded decks
Real decks that closed rounds, grouped by what each did well.
visme.co →Duarte — Resonate / slide:ology
Story structure for presentations: tension and resolution, not a list of facts.
duarte.com →A real board deck, rebuilt end-to-end
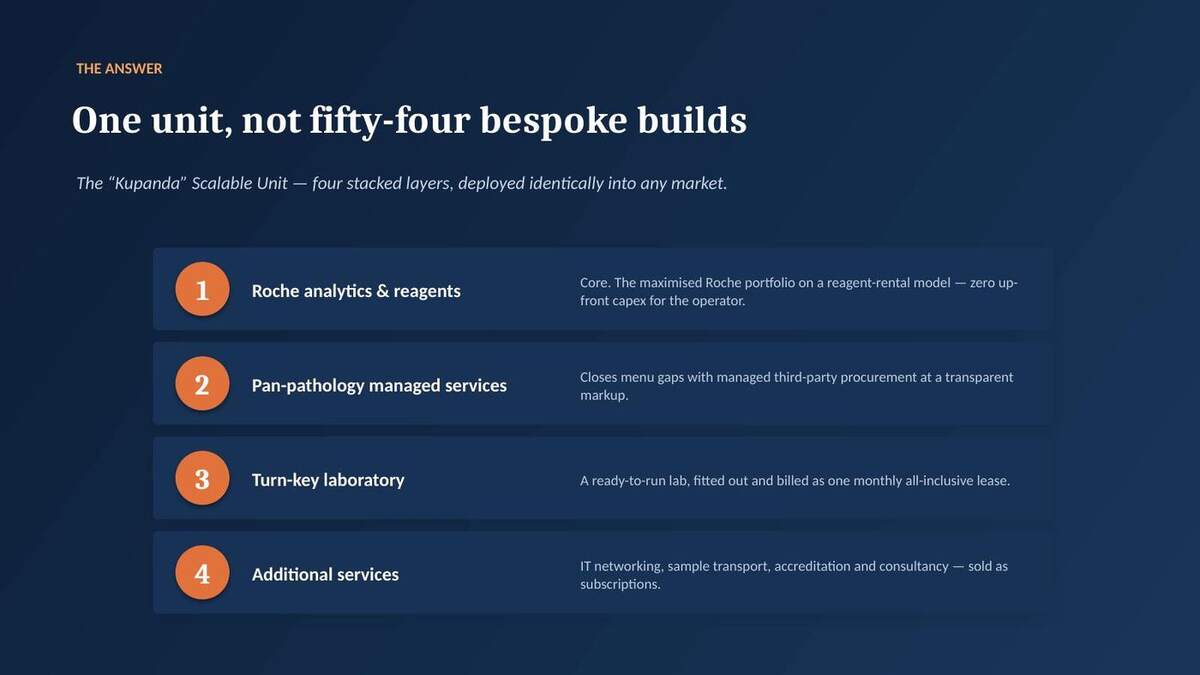
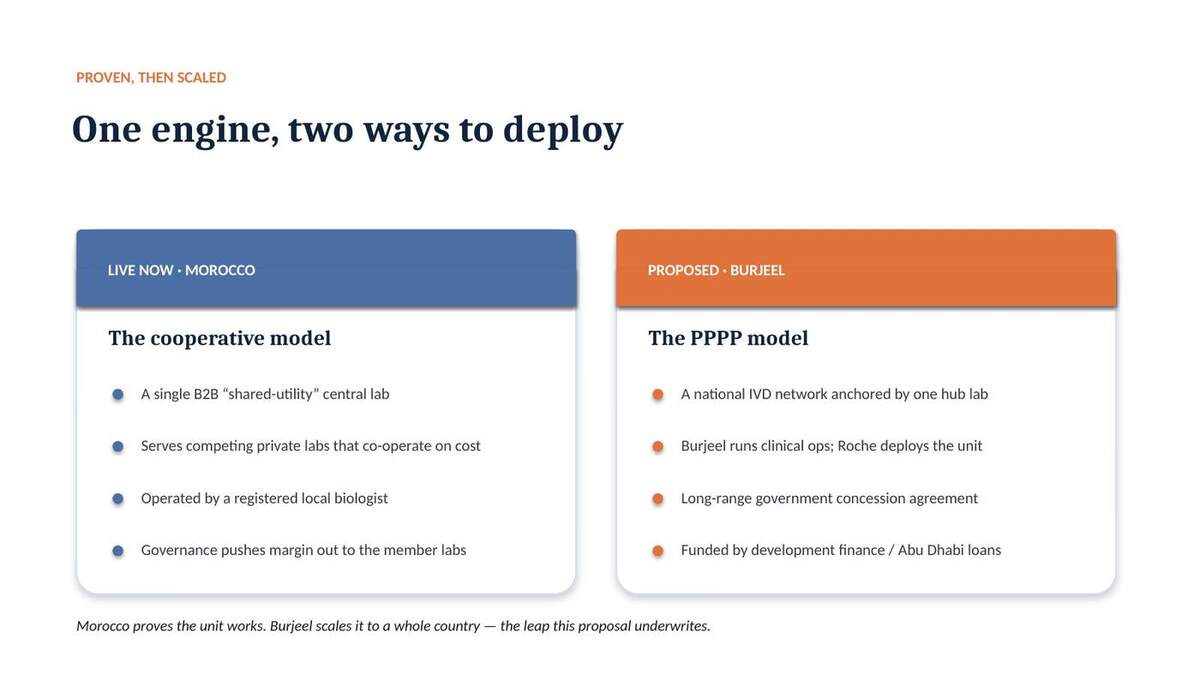
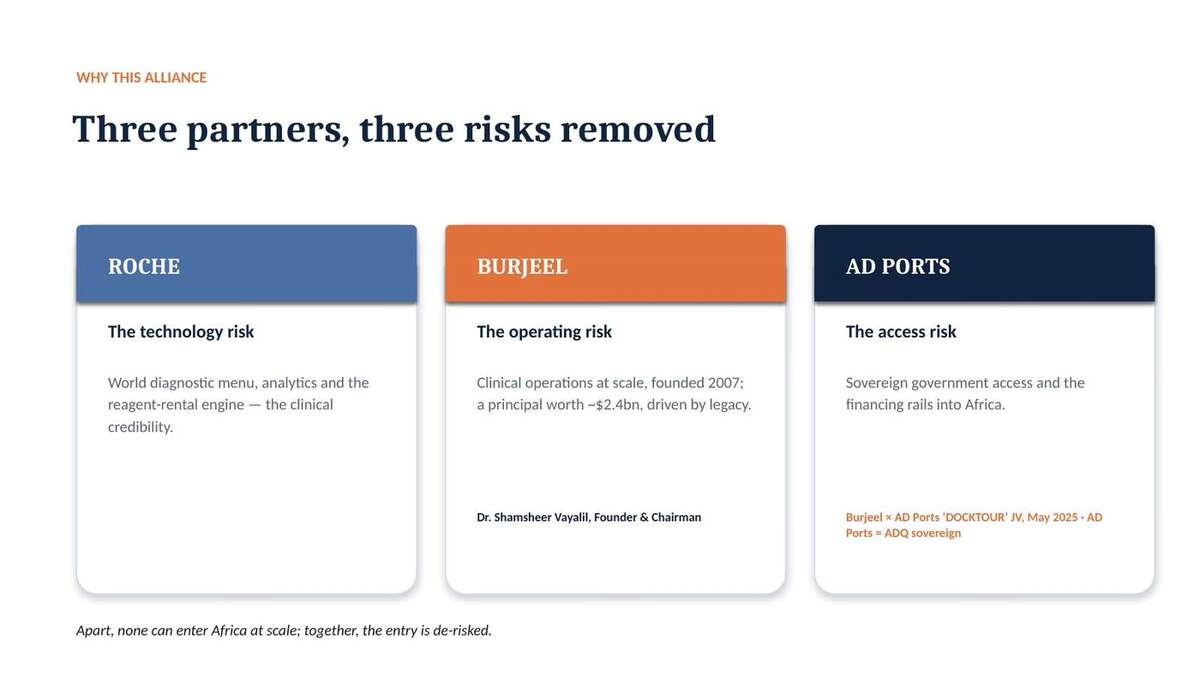
A confidential 13-slide strategy deck — half of it AI-generated narrative — re-cut to eleven action-titled slides: real photography, every figure sourced, the model and money in clean data-viz. The original asked the board to back a continental rollout; the rebuild asks for one small, reversible pilot, and proves every step.
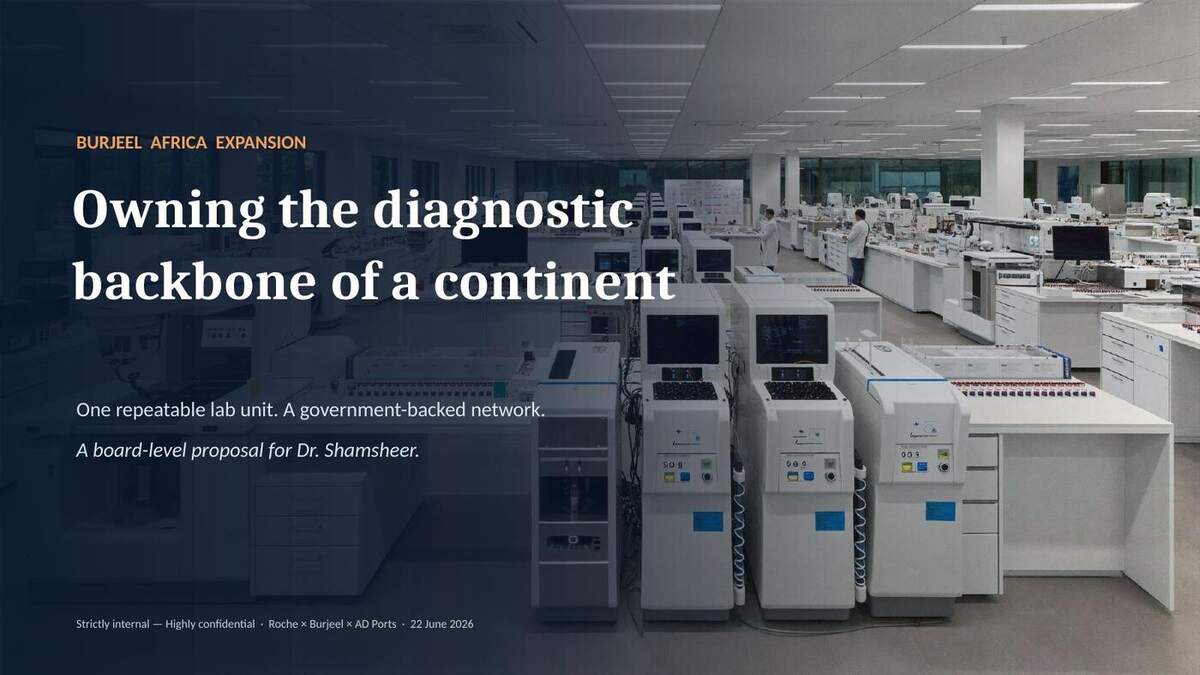
↓ Download the editable .pptx → Eleven slides, real photography, two data slides from live World Bank data, every figure sourced; three headline options in each slide's speaker notes.
Before / after
| Original (13 slides) | Rebuild (11 slides) |
|---|---|
| ~7 of 13 slides AI-generated in NotebookLM — scaffolding presented as strategy | Every slide purpose-built; the genuine model kept, the filler cut |
| Topic titles ("The Vision", "Four Levels of Impact") | Action titles — the headline is the argument |
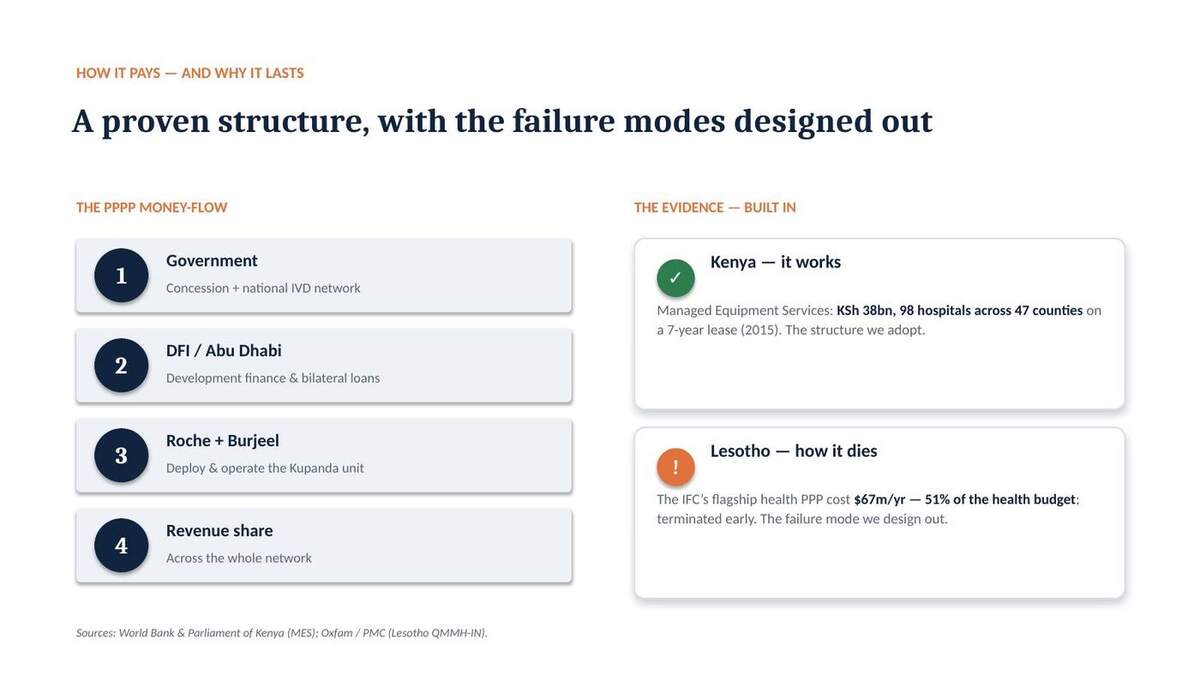
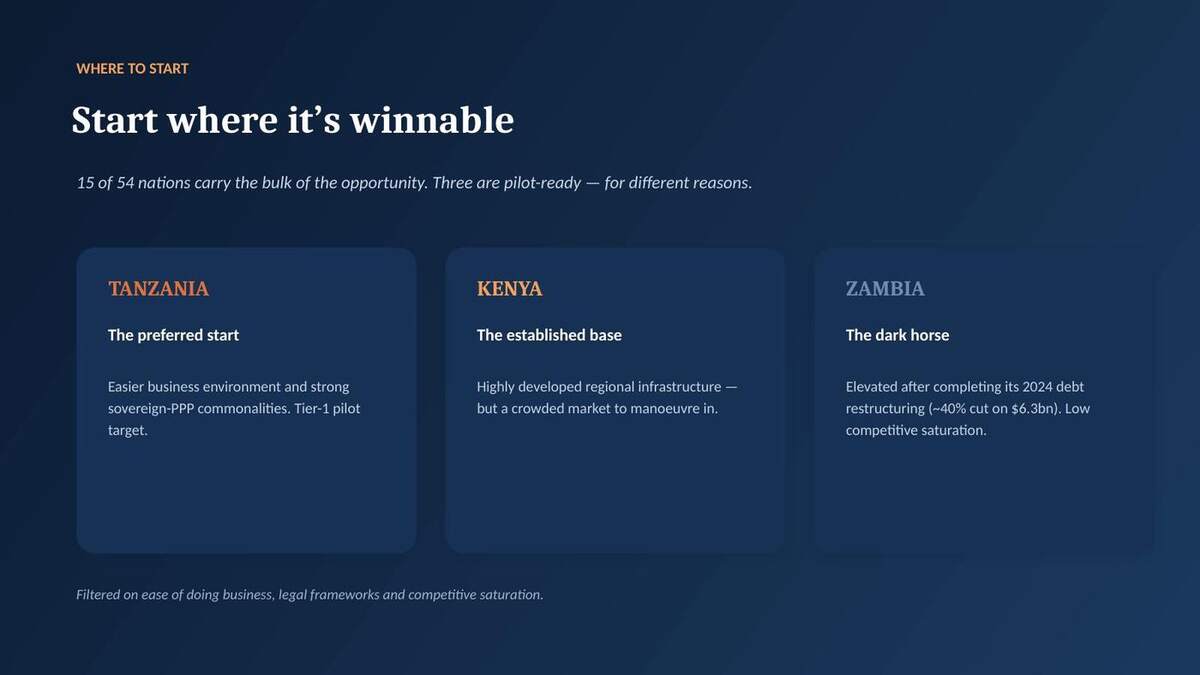
| Claims asserted, unsourced ("15 nations = 80%") | Sourced or cut; Kenya MES & Lesotho QMMH added as real, costed precedents |
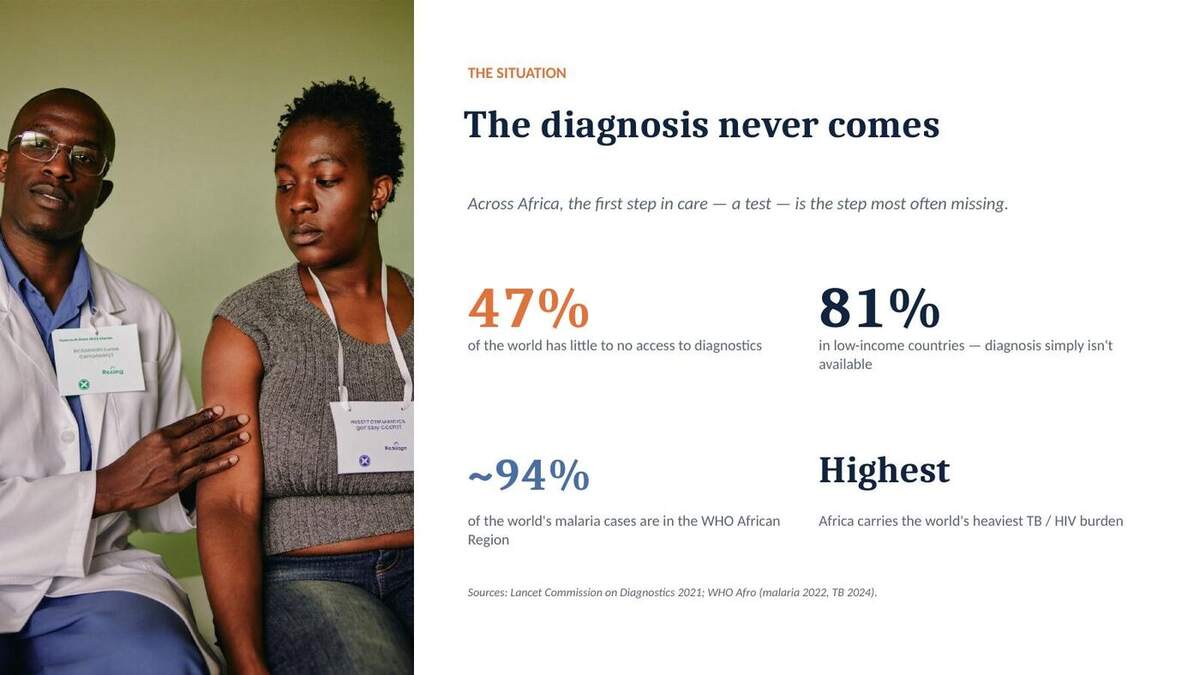
| Empty stat slides, no imagery | Dense sourced factoids + real photography on the human slides |
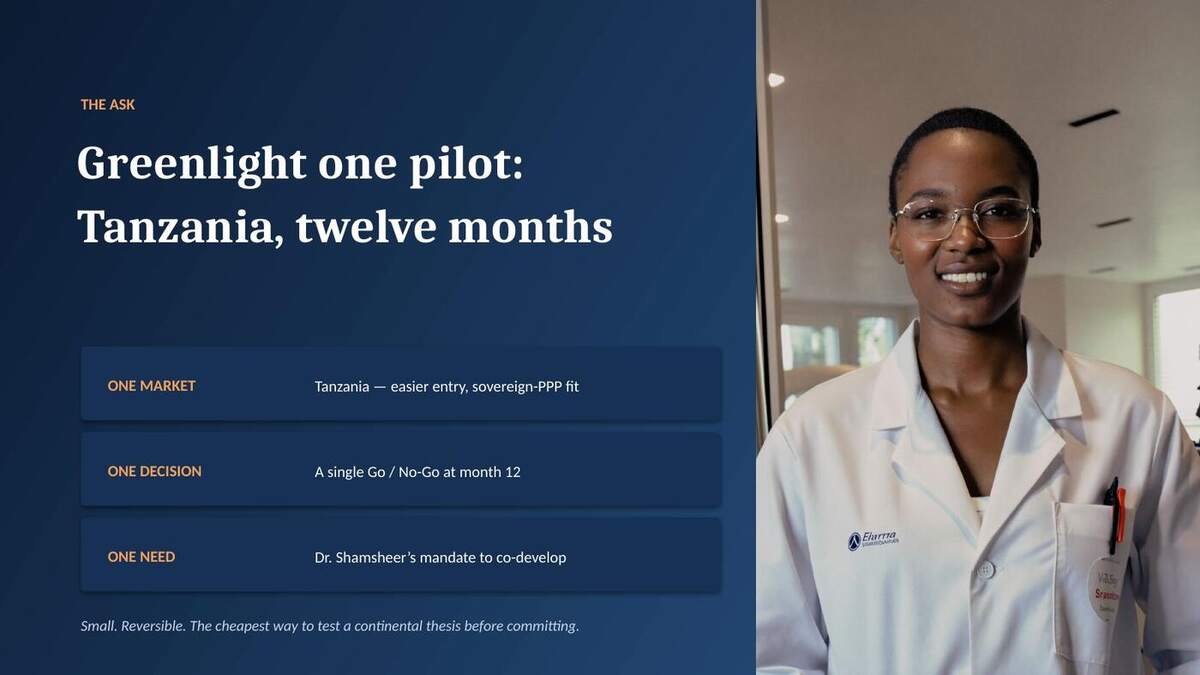
| Ask: back a continental rollout | Ask: one reversible 12-month pilot with a single Go/No-Go |
The data that lifted it
A note on confidentiality
The source material was marked strictly internal — highly confidential. This page is noindex and unlisted, but reachable by anyone with the link. Treat the URL as sensitive — say the word to password-gate it or swap in a sanitised dummy.